Green bean fertilizer requirements can be calculated if you know your soil type and have a good idea of the yield potential of your land and climate. These are basic norms and your specific microclimate and variety can have an influence on the total amount applied. These norms do not take top dressings into account, only the total amount of N, P and K applied during the growth season. The fertilizer can be applied either through the irrigation system or as granular fertilizer. Consult your supplier on the effectiveness of these fertilizers on the various soils to make adjustments to these amounts.
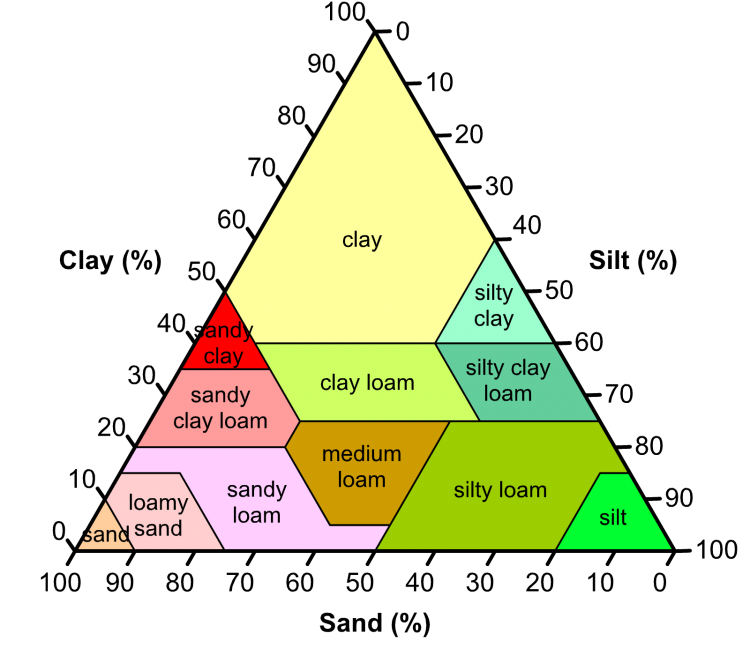
Three soils are used in these tables:
- S/SL – Sandy to Sandy Loam
- SL/S – Sandy Loam to Sand
- SCL/C – Sandy Clay Loam to Clay
Although inorganic fertilizers are discussed here, the application of organic material such as compost has a significant effect on all parameters of green bean growth and yield. This is especially true if green beans are planted on virgin soils or soils with low fertility. The presence of organic matter increased plant height, number of leaves as well as fresh and dry weights of the plant 1)Abdel-Mawgoud, A.M.R.. (2006). Growth, Yield and Quality of Green Bean (Phaseolus Vulgaris) in Response to Irrigation and Compost Applications. Journal of Applied Applied Science Research. 2. 443-450. .
Nitrogen (N) application
Green bean fertilizer requirement ito nitrogen is easy. You don’t need a soil analysis just a good idea of your yield potential in the area. Be careful not to overestimate your potential yields as too much nitrogen will also have a negative effect on total yield and the quality of the pods. High nitrogen content makes the plant more susceptible to insect damage and diseases.
| Yield target t/ha | S/SL | SL/S |
|---|---|---|
| 0-10 | 120-140 | 100-120 |
| 11-15 | 140-180 | 120-160 |
| 15-20 | 180-220 | 160-220 |
Phosphorus (P) – (Bray 1)
Phosphorus fertilizer requirements are based on Bray 1 lab analysis. If another method is used the values must be adjusted. The minimum amount applied is always about 20 kg P per hectare as P is not that mobile and a certain level of P must always be maintained in the soil.
| P analysis (ppm) | Yield target 5-18 t/ha | Yield target 18+ t/ha |
|---|---|---|
| 1-10 | 120-140 | 140 |
| 11-20 | 100-120 | 112 |
| 21-30 | 80-100 | 88 |
| 31-40 | 80-100 | 88 |
| 41-60 | 40-60 | 48 |
| 61-80 | 20-40 | 35 |
| 81-100 | 0-20 | 20 |
| 101-120 | 20 | 20 |
| 121-200 | 20 | 20 |
Potassium (K)
Potassium requirements are based on a soil analysis and yield estimates. Potassium is extremely important for flower formation and water regulation. Over fertilization can increase the salt content of the soil to such an extent that water uptake is reduced. Note that low nitrogen soil content will impair the translocation of potassium to other parts of the plant. A potassium deficiency in the plant will not be noticed as quickly as nitrogen or iron. Deficiency symptoms occur first in the older leaves as potassium is transferred to younger leaves first. Note that beans are sensitive to salt stress, so too high applications can reduce yields.
| Soil type | Soil analysis | Yield t/ha | ||
|---|---|---|---|---|
| ppm | 0-10 | 11-15 | 16-20 | |
| S/LS | 1-20 | 140 | 160 | 180 |
| SL/L | 1-30 | 140 | 160 | 180 |
| SCL/C | 1-40 | 140 | 160 | 180 |
| S/LS | 12-40 | 118 | 134 | 150 |
| SL/L | 31-60 | 118 | 134 | 150 |
| SCL/C | 41-80 | 118 | 134 | 150 |
| S/LS | 41-60 | 96 | 108 | 120 |
| SL/L | 61-90 | 96 | 108 | 120 |
| SCL/C | 81-120 | 96 | 108 | 120 |
| S/LS | 61-80 | 74 | 82 | 90 |
| SL/L | 91-120 | 74 | 82 | 90 |
| SCL/C | 121-160 | 74 | 82 | 90 |
| S/LS | 81-100 | 52 | 56 | 60 |
| SL/L | 121-150 | 52 | 56 | 60 |
| SCL/C | 161-200 | 52 | 56 | 60 |
| S/LS | 101-121 | 30 | 30 | 30 |
| SL/L | 151-180 | 30 | 30 | 30 |
| SCL/C | 201-240 | 30 | 30 | 30 |
| S/LS | 121+ | 0 | 0 | 0 |
| SL/L | 180+ | 0 | 0 | 0 |
| SCL/C | 241+ | 0 | 0 | 0 |
Below is the well known soil texture triangle on which the recommendations are based. Most commercial agricultural soils are found in the left bottom corner as they are the most productive and provide the plant with best yield potentials.

Soil textural triangle.2)https://commons.wikimedia.org/wiki/File:USDA_Soil_Texture.svg by Christopher Aragón
References
| ↑1 | Abdel-Mawgoud, A.M.R.. (2006). Growth, Yield and Quality of Green Bean (Phaseolus Vulgaris) in Response to Irrigation and Compost Applications. Journal of Applied Applied Science Research. 2. 443-450. |
|---|---|
| ↑2 | https://commons.wikimedia.org/wiki/File:USDA_Soil_Texture.svg by Christopher Aragón |


Leave A Comment
You must be logged in to post a comment.